Graphs and data I find interesting.
GIF
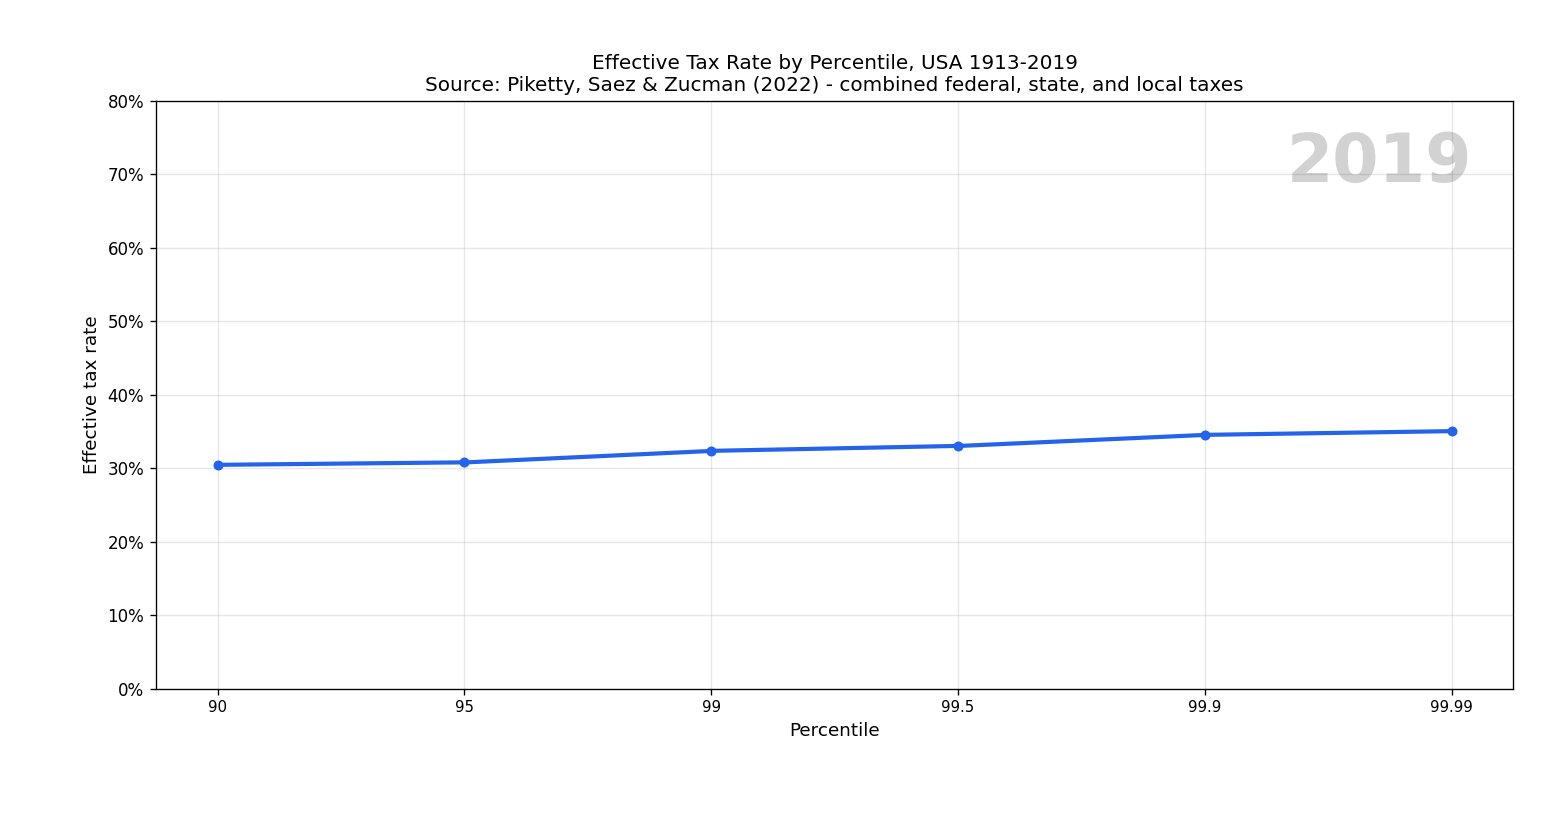
US Effective Tax Rates by Percentile Over Time
Effective tax rates by percentile group, animated annually from 1913 to 2019.
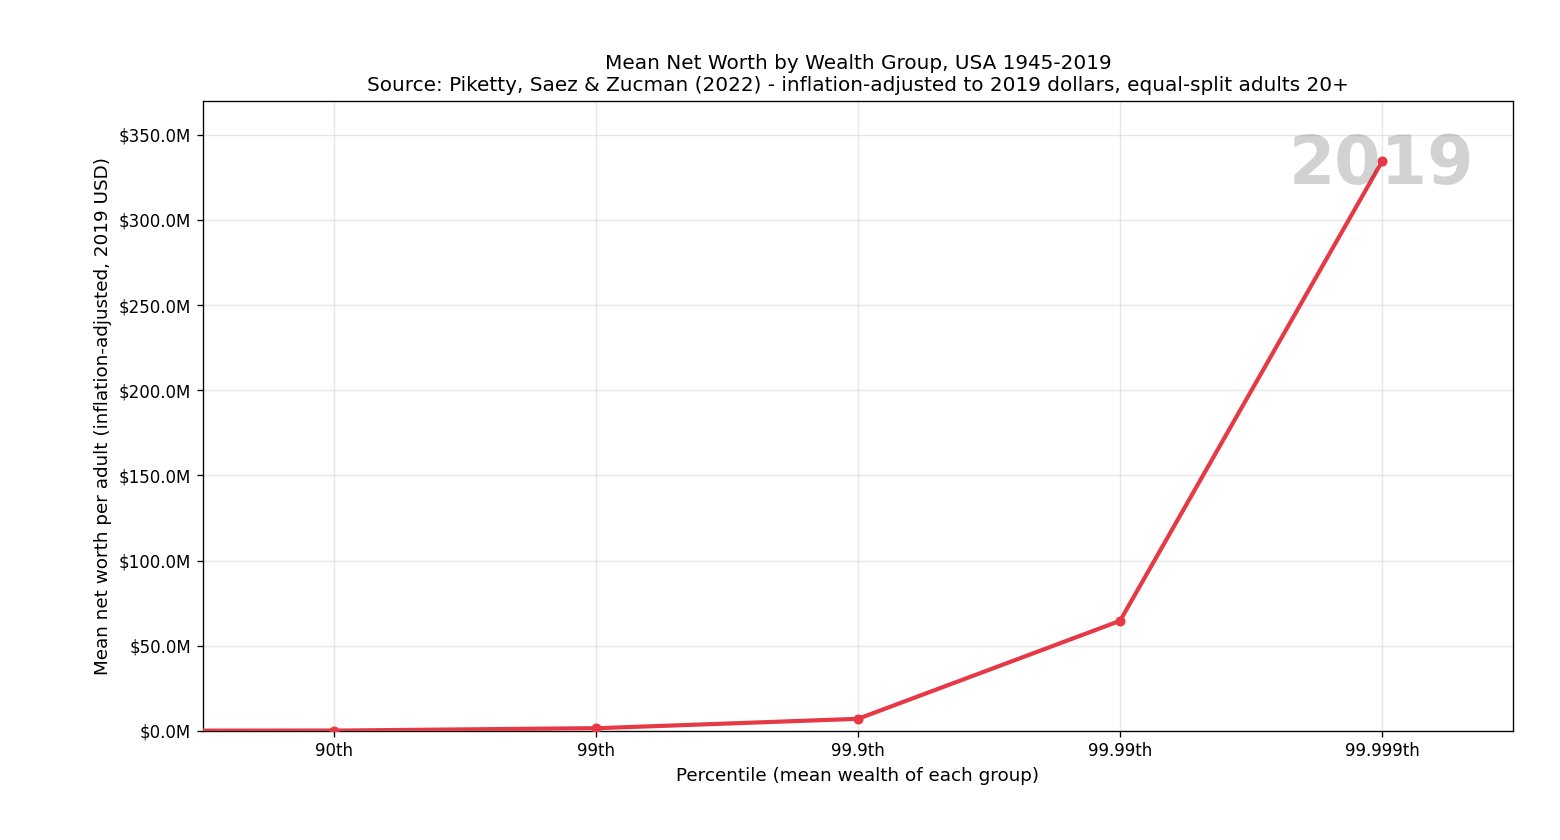
US Wealth Distribution (1945–2019)
Mean net worth per adult by wealth group, animated annually. Adjusted for inflation to 2019 dollars.